England’s maths progress and the questions the TIMSS data leaves us with.
I’ve finally had the chance to dive a bit deeper into the latest TIMSS report (as you do!). Partly because I’m researching for some videos I’m putting together for Rethink Maths, but also because I’ve always found these long-term international studies fascinating.
Yes, the data is a little out of date, and not many people are talking about it right now. However with the government reflecting on curriculum and assessment, I think this is exactly the moment to look again.
There’s plenty to celebrate. Over the last 25 years, England’s maths performance has risen steadily. We’re now consistently in the upper tier internationally – a real credit to teachers, pupils and schools.
When you look beyond the averages, some significant trends appear and these are what we need to focus in on when thinking about the future of maths policy.
Over the next week I’ll share the three trends I think matter most.
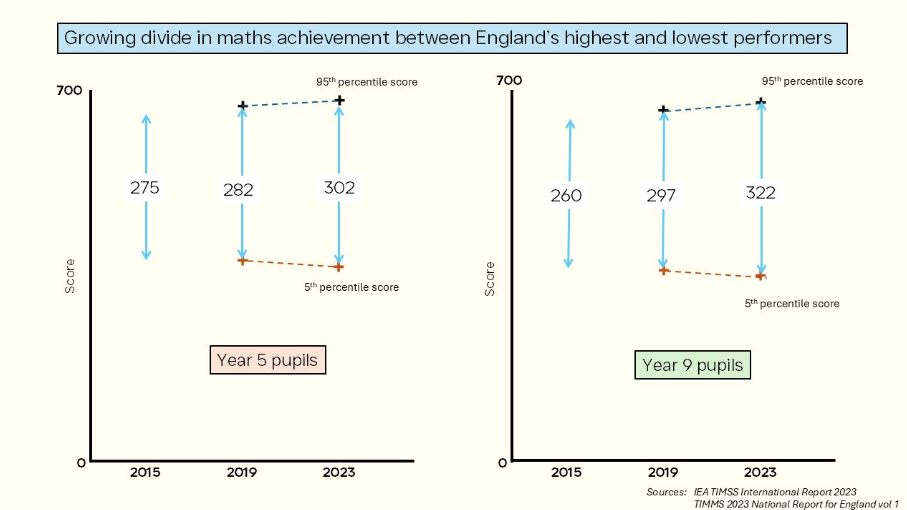
Trend 1: Here’s a graph I created for one of the videos. It shows the growing gap in maths achievement between England’s highest and lowest achievers. Over time, this spread has widened to become one of the largest in the world.
The 2014 national curriculum and teaching for mastery aimed for “ambition for all” – closing gaps and moving pupils forward together. Yet the data perhaps suggests a different story. It appears our top achievers have surged ahead, while those at the lower end haven’t kept pace.
So where do we go from here? Averages are rising, but the gaps are widening. Does this match your experience and if so, what’s the single biggest thing we should change? What should we be rethinking to make sure every child moves forward?
I’d love to know what you see in this picture and what it makes you think about what we should be doing next.